Bulgaria waste statistics — what the official numbers actually measure
A plain-English guide to Bulgaria's municipal waste, packaging and collection statistics, including what the headline totals can and cannot tell you about litter.
Recently verified — 1 August 2026
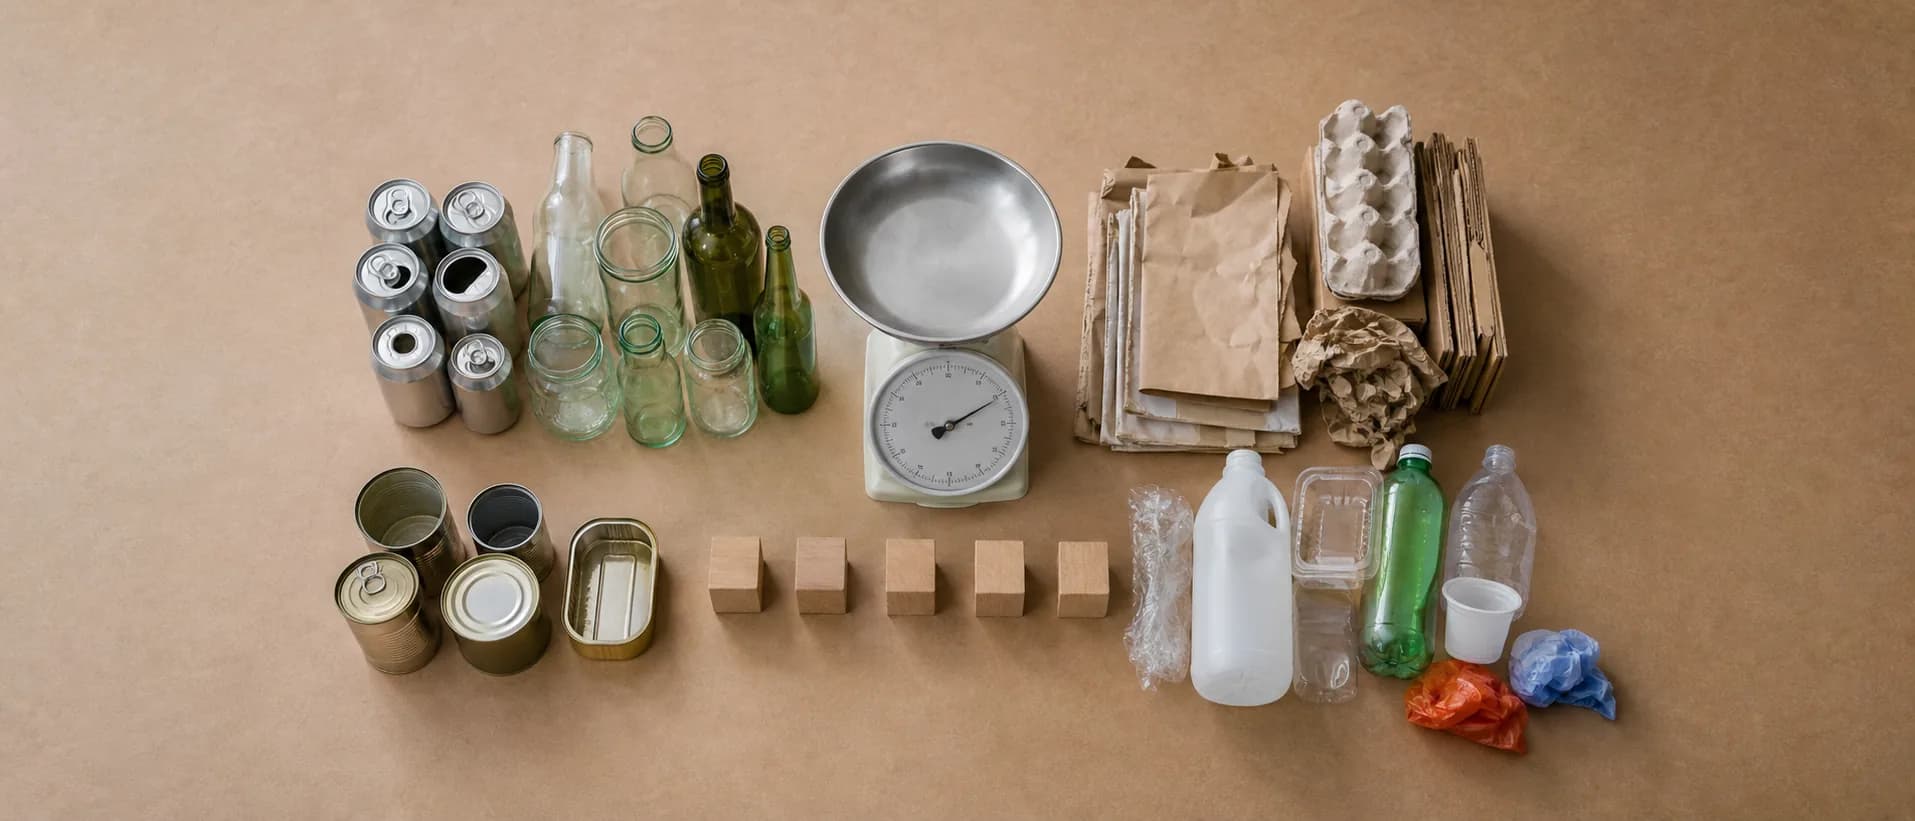
Bulgaria generated 3.192 million tonnes of municipal waste in 2024, or 496 kilograms per person, according to the National Statistical Institute (NSI). Those are the right headline figures to quote, but they do not mean that the average resident personally carried 496 kilograms to a household bin. Municipal waste also includes similar waste collected from shops, offices and public services.
The same release says 99.94% of the population was served by an organised waste-collection system. That measures access to a service, not perfect collection, correct sorting or the absence of illegal dumping.
Municipal waste is not the same as litter
The municipal total is built from formal reporting. A bottle collected from a city bin can enter that dataset; a bottle in a ravine may remain invisible until somebody removes it. Construction rubble, agricultural waste and industrial waste can also fall into separate statistical categories even when residents encounter them beside household rubbish at an illegal dump.
That distinction matters when using statistics to plan a cleanup. National totals describe the system. A location report describes the job in front of you. On Garbamons' litter-reporting map, photographs, waste types, access and a realistic bag estimate make a local problem actionable without pretending it represents the whole country.
Packaging placed on the market
The NSI reported 458,000 tonnes of packaging placed on the market in 2024, including 139,800 tonnes of plastic packaging. “Placed on the market” is an upstream measure: it records packaging supplied in Bulgaria. It is not the quantity recycled, landfilled or leaked into nature.
Those later stages require different datasets. When comparing two reports, check whether both are discussing:
- packaging or all municipal waste;
- material placed on the market or waste collected;
- tonnes in total or kilograms per person;
- a calendar year or a rolling reporting period;
- preliminary or revised values.
Mixing those categories can create an impressive-looking but meaningless percentage.
Why per-person figures help—and where they fail
Kilograms per person make countries and years easier to compare when populations differ. They are still affected by tourism, commuting, data revisions and the treatment of commercial waste. A coastal municipality in August serves far more people than its permanent population suggests; a capital collects waste generated by commuters and businesses as well as residents.
Use the per-person number for broad trends, not to estimate how many bags will be on a beach or trail. For a field project, scout the site and classify the material first.
Turning a national figure into local action
Good local evidence has a smaller scope and a clearer purpose. Record the coordinates, date, photographs, broad waste types, hazards, vehicle access and estimated effort. If the site contains drums, asbestos, medical waste or unstable debris, do not translate it into “bags”; report it to the responsible authority.
A mapped location can then support three different outcomes: an individual removes a small amount, an organiser creates a properly scoped cleanup event, or a municipality receives a precise report for material volunteers should not handle. National statistics explain why prevention matters. Field records explain what needs to happen next.
A useful annual check
The NSI revises its environment pages as new reference years are published. Before reusing any number, open the current release, confirm the reference year, and keep the older value if you are describing a trend rather than replacing history. A statistic with its year attached stays useful; a floating number becomes stale almost immediately.
Sources & further reading
- Environmental Statistics 2024 — National Statistical Institute of Bulgaria
- Municipal waste data — National Statistical Institute of Bulgaria
Access, prices and opening times change. Verify locally before you travel.
Tags
- Bulgaria
- waste statistics
- municipal waste
- packaging
Further reading
Links to reference material and organisations we don't control.
- ReferencePlastic pollutionWikipedia
- OfficialPlastics in Europe — briefings and dataEuropean Environment Agency
- OrganisationPlastic Pollution CoalitionPlastic Pollution Coalition
- VideoUN Environment Programme on YouTubeYouTube