California beach litter data — what decades of cleanup counts show
How to read California Coastal Cleanup Day's long-running item counts, including the top categories from 1988–2023 and the limits of volunteer data.
Recently verified — 31 July 2026
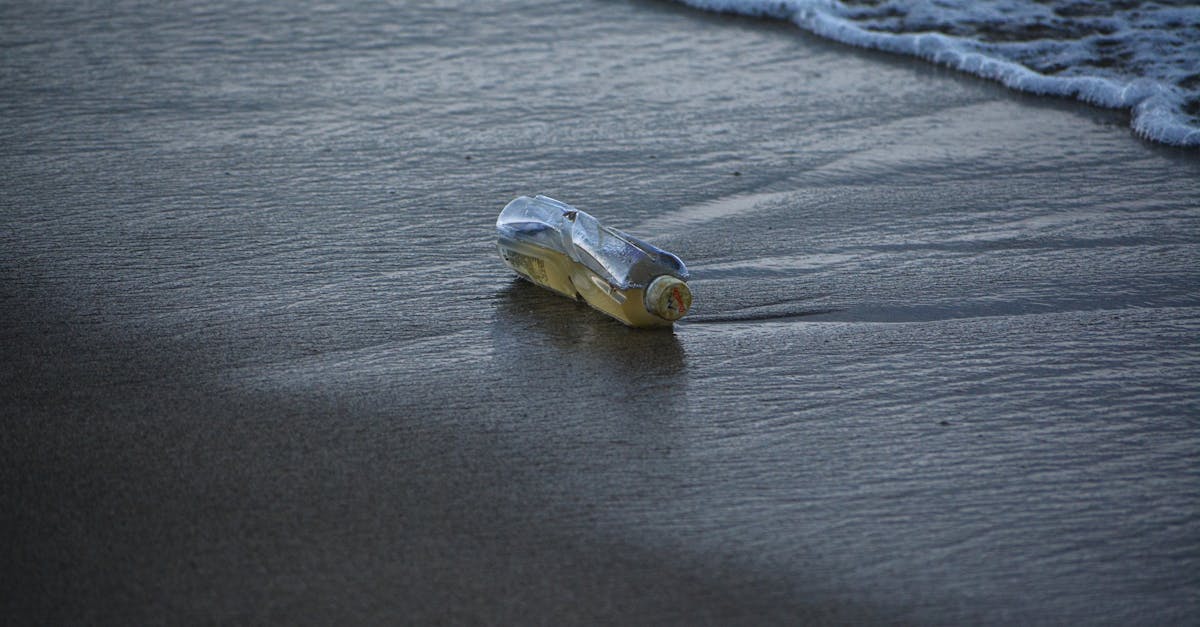
California Coastal Cleanup Day has produced one of the country's most visible volunteer litter records. The California Coastal Commission publishes yearly results and a historical top-ten table. It is powerful evidence of what volunteers encounter—but it is not a random sample of every foot of coast.
For 1988–2023, the Commission's table lists cigarette filters first with 8,403,338 items, or 35.34% of the recorded top-level total. Food wrappers and containers follow at 2,592,161; caps and lids at 2,207,929; paper and plastic bags at 1,723,026.
What this table can support
It supports the statement that cigarette filters and food-service packaging have been persistent, high-count finds in the California event dataset. It can guide volunteer briefing, prevention campaigns and more detailed local monitoring.
The Commission also explains that cleanup data have informed public discussion and policy on single-use products and stormwater trash. That is a stronger, more specific claim than saying a cleanup “proved” where all ocean plastic originates.
What it cannot support by itself
The historical count does not estimate total litter on California's coast. Event sites, volunteer turnout, searched distance, methods and participation change. Items are not equal in mass or harm: one large net and one filter are both one item in a simple count.
Do not divide the total by coastline miles or years and present the result as an ecological concentration. Standardized NOAA monitoring uses defined methods for that kind of comparison.
Counts and weights tell different stories
Small items dominate counts. Waterlogged wood or bulky dumping can dominate weight. California publishes volunteer, trash and recyclable weights for individual event years, but those totals reflect the sites and effort mobilized that year.
When reporting a local event, publish both where feasible:
- item counts by a stable category list;
- bag count and safely measured weight;
- volunteers, time and distance or area;
- tide, weather and unusual events;
- disposal destination.
Build a local series
Select repeatable boundaries and fixed photo points. Use the same category definitions each time. If the route or effort changes, record it instead of forcing a comparison.
Store the dated visual record as a before-and-after gallery. If a wrack line or creek mouth repeatedly accumulates debris, map the hotspot with waste types and access notes for targeted action.
Cite the exact range
California updates its pages. When repeating a table, state “California Coastal Cleanup Day data, 1988–2023,” include the access date and link to the Commission. Do not quietly turn a historical range into a current-year claim.
Good cleanup data does more than make a large number. It preserves enough context to show what was counted, where, when and by which method—so the next decision is better than the last.
Sources & further reading
- Coastal Cleanup Day history and data — California Coastal Commission
- 2024 Coastal Cleanup Day totals — California Coastal Commission
Access, prices and opening times change. Verify locally before you travel.
Tags
- California
- litter statistics
- plastic pollution
- community science
Further reading
Links to reference material and organisations we don't control.
- ReferencePlastic pollutionWikipedia
- OfficialPlastics in Europe — briefings and dataEuropean Environment Agency
- OrganisationPlastic Pollution CoalitionPlastic Pollution Coalition
- VideoUN Environment Programme on YouTubeYouTube