River plastic pollution numbers — why one “top polluting rivers” list is not enough
How global river-plastic estimates are modelled, why small urban rivers matter and how field observations can support action without false precision.
Recently verified — 2 August 2026
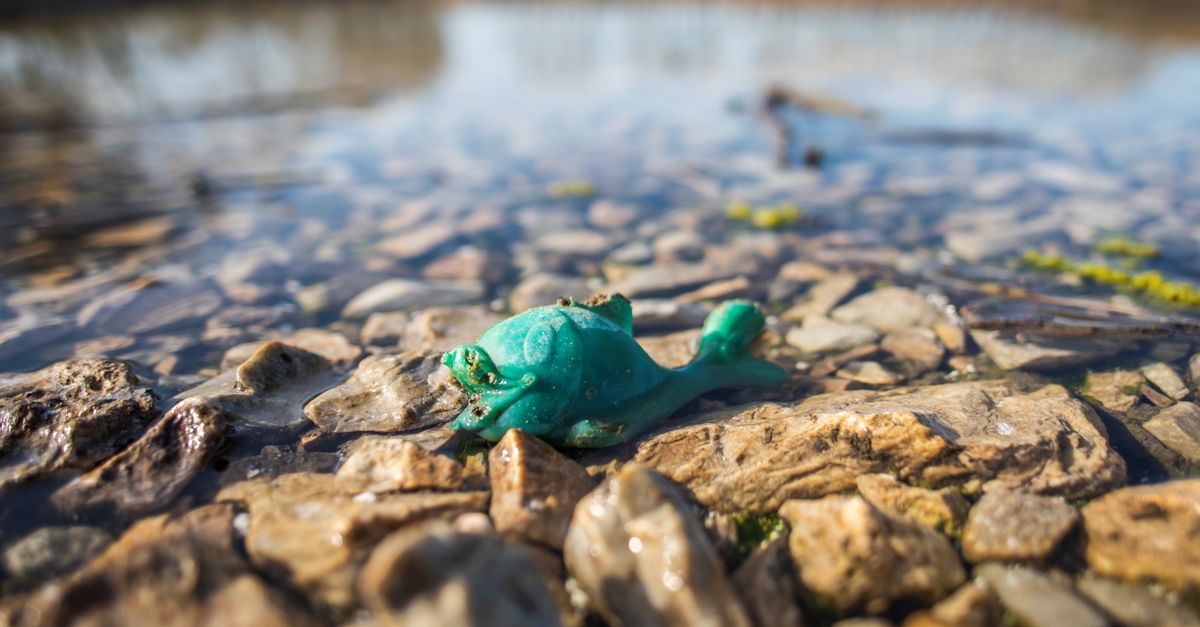
Rivers connect streets, dumps, drainage systems and coasts, but there is no global weighbridge at every river mouth. River-plastic totals are estimates built from waste generation, management, population, hydrology and field measurements. Their uncertainty is part of the result.
UNEP's World Water Quality Alliance summarises research estimating that more than 1,000 rivers account for 80% of annual riverine plastic emissions. This updated picture challenged an earlier narrative that a handful of very large rivers dominate. Small rivers flowing through densely populated coastal cities can deliver high loads because discarded material has a short path to the sea.
Do not combine unlike models
UNEP reports 19–23 million tonnes of plastic entering aquatic ecosystems annually. Its riverine technical overview also discusses estimates for waste reaching rivers and much wider ranges for microplastics. These values come from different boundaries and methods.
A global aquatic-leakage range is not a direct measurement of river export to the ocean. Material can be retained on banks, floodplains, vegetation, reservoirs and riverbeds, then remobilised later. Counting floating objects at one bridge misses submerged and stranded fractions.
Read the catchment
Map storm drains, tributaries, informal dumping areas, markets, industrial zones, wastewater overflows and flood paths. Observe after different weather, because a dry-season surface count and a first-flush event represent different transport states.
At a fixed bridge, record observation duration, visible channel width, flow condition and items passing a reference line. On banks, use fixed segments and count before removal. Keep floating, stranded and embedded material separate.
Cleanup location is a safety decision
Intercepting litter upstream may be safer and more effective than sending volunteers into water. Screens and booms can also obstruct flow, navigation or wildlife and may fail catastrophically during floods. They require engineering, permits, frequent servicing and an agreed waste destination.
Never wade in polluted, swift or flood-affected water for a bottle. Avoid steep undercut banks and do not pull objects that stabilise a bank or contain wildlife. A river cleanup plan needs a weather cancellation threshold and someone responsible for monitoring upstream conditions.
Use a mapped river-cleanup event to publish boundaries, water exclusions and the collection plan. For a newly observed dump above the bank, log its coordinates, access and visible waste mix after reporting hazardous or illegal material officially.
Prevention evidence is upstream
Classify recognizable objects and investigate systems, not presumed people. Repeated beverage packaging may justify bin placement, deposit-return enforcement or vendor engagement. Construction sacks below one drain may indicate a specific leakage pathway. Sanitary items can point to sewer overflow rather than direct littering.
Photograph the same points and keep rainfall context. A falling count during drought is not proof of prevention if accumulated material simply has not moved. Conversely, a large post-flood collection does not mean the river suddenly became worse that week.
Communicate without false precision
Say “a model estimates,” “observers counted,” or “volunteers removed.” Each verb identifies an evidence type. Global estimates establish the scale of plastic leakage; repeatable local records reveal where a catchment can intervene. The bridge between them is careful method, not a dramatic multiplication of one afternoon's bag count.
Sources & further reading
- Riverine plastic pollution — UNEP World Water Quality Alliance
- Plastic pollution and marine litter — UNEP
Access, prices and opening times change. Verify locally before you travel.
Tags
- rivers
- plastic
- statistics
- monitoring
Beyond this page
Links to reference material and organisations we don't control.
- ReferenceMarine debrisWikipedia
- ReferenceGhost netsWikipedia
- OrganisationThe Ocean Cleanup — rivers and ocean plasticThe Ocean Cleanup
- VideoThe Ocean Cleanup on YouTubeYouTube